Data Analytics Agency
Check our Data Visualization services!
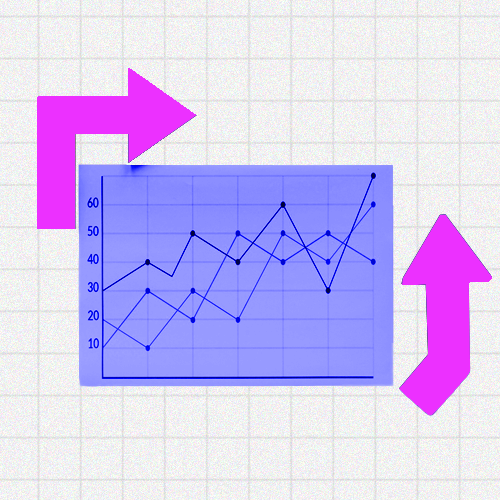
At Super Plural, we transform raw data into stunning visual stories. Using Power BI, Tableau, and our very own Super Plural Analytics, we create dashboards that make complex data easily understandable. From interactive graphs to detailed charts, our visualizations help you see trends, uncover insights, and make informed decisions at a glance.

simple and effective
Power BI
At Super Plural, we transform raw data into stunning visual stories. Using Power BI, Tableau, and our very own Super Plural Analytics, we create dashboards that make complex data easily understandable. From interactive graphs to detailed charts, our visualizations help you see trends, uncover insights, and make informed decisions at a glance.

constantly growing
Tableau
Our insightful tools go beyond the basics. With heatmaps and screen recorders, we delve into user behavior, identifying patterns and preferences. Machine learning algorithms take it a step further, predicting future trends and automating data analysis. These tools not only provide clarity but also drive smart, data-driven strategies.

only the top matters
Super Plural Analytics
Efficient data management is at the heart of what we do. Through ETL processes, we extract, transform, and load data to ensure it's clean and ready for analysis. Web scraping allows us to gather real-time data from various sources, while robust data governance practices ensure integrity, security, and compliance, turning data into a reliable strategic asset.
Strong growth
Let the numbers talk!
We provide support for more than 1K+ Businesses.


