Business Intelligence tools allow companies to efficiently capture, analyze and visualize data, transforming complex information into actionable insights. The ability to visualize data clearly and intuitively makes it easier to understand trends and patterns, empowering companies to make informed strategic decisions.
Given the diversity of BI solutions available on the market, it is essential to compare these tools to find the one that best meets the specific needs of each organization. Different tools offer different functionalities, integrations with other systems, visualization options and cost structures. Thus, careful analysis helps to ensure that the choice made will be the most in line with the company’s business objectives, technological capabilities and budget.
Top 5 Business Intelligence tools
In this article, we explore some of the main BI tools used today, highlighting their advantages and disadvantages, and providing examples of large companies using them in their operations. This comparative analysis is essential to help your company make an informed choice, ensuring that you maximize the value of your Business Intelligence strategies.
Microsoft Power BI
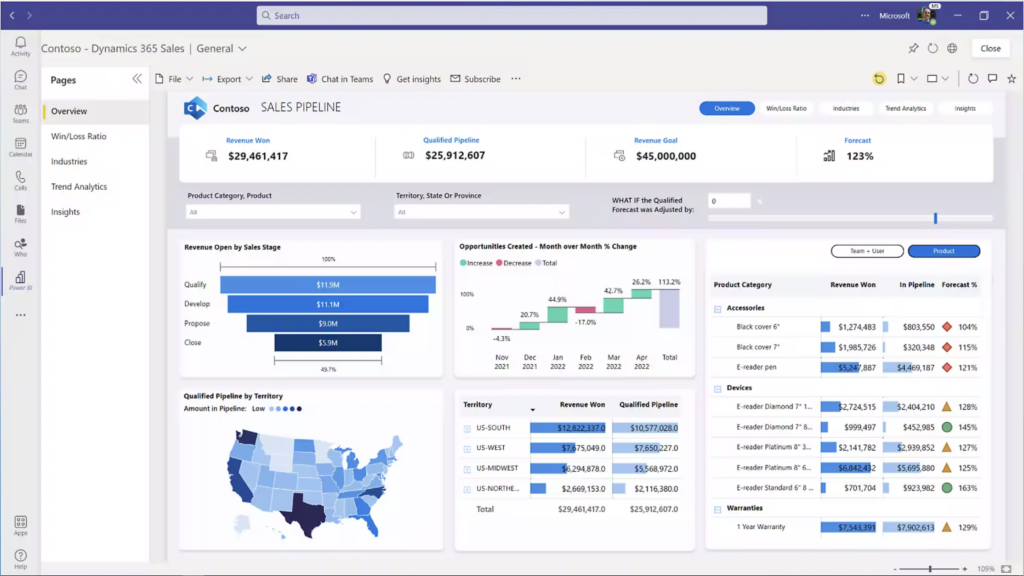
Developed by Microsoft, Power BI has established itself as the leading BI tool, with a substantial market share. Introduced in 2011, Power BI offers a user-friendly interface, seamless integration with the Microsoft ecosystem and various visualization options. These features make it an attractive choice for organizations looking for simplicity and powerful data analysis. Notable companies such as Adobe, Nestlé and GE use Power BI for their BI needs.
Advantages:
- Seamless integration with the Microsoft environment.
- Fast data processing capabilities.
- Extensive visualization options via marketplace.
- Competitive licensing costs.
Disadvantages:
- Limited to Windows environments.
- Slower performance with extremely large data sets.
Tableau
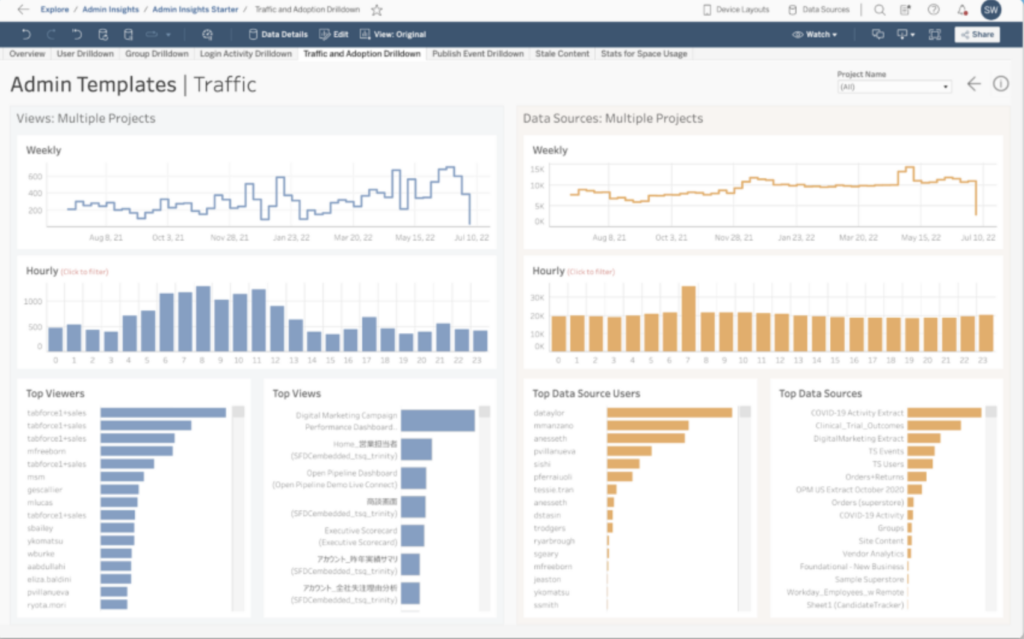
Acquired by Salesforce in 2019, Tableau is another giant on the BI scene. Known for its robust visualization capabilities and user-friendly interface, Tableau holds a significant market share. Large companies such as Amazon, LinkedIn and Deloitte use Tableau’s end-to-end data analysis solutions for detailed data exploration and visualization.
Advantages:
- Integration with the Salesforce ecosystem.
- Multi-platform compatibility.
- Easy connection to various data sources.
Disadvantages:
- Higher cost compared to Power BI.
- More suitable for data specialists.
Qlik
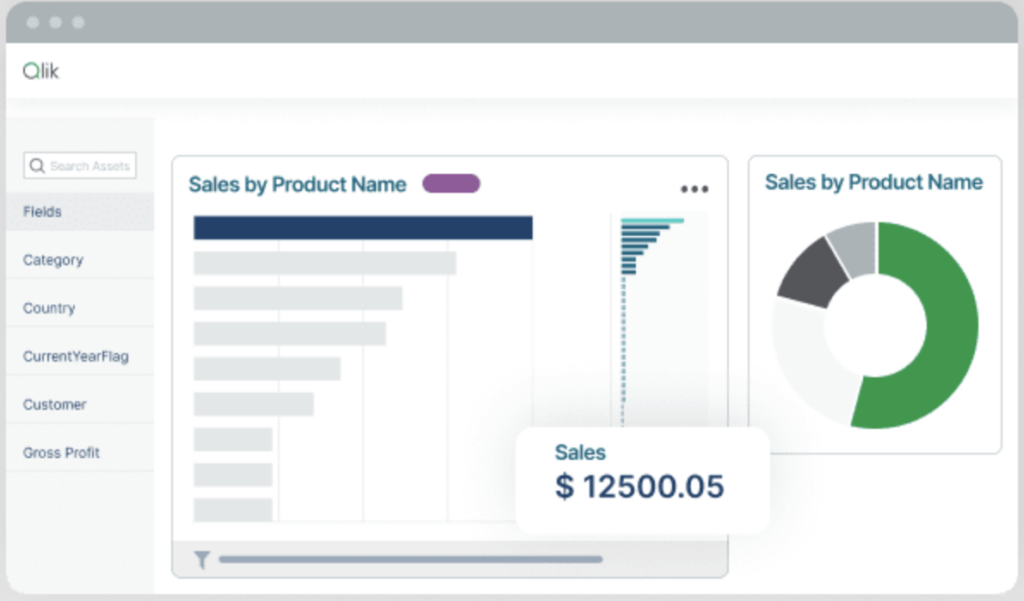
Launched in Sweden in 1993, Qlik offers advanced data preparation and high performance with large data sets. As the third largest player in the market, Qlik’s distinctive advantage lies in its non-query-based platform, which identifies unique data patterns. Prominent organizations such as Nissan, L’Oréal and Vodafone use Qlik for its powerful data association capabilities.
Advantages:
- Strong performance with large data sets.
- End-to-end cloud BI solutions.
- User-friendly interface.
Disadvantages:
- Requires a robust computer system.
- Limited support and customer service.
Looker
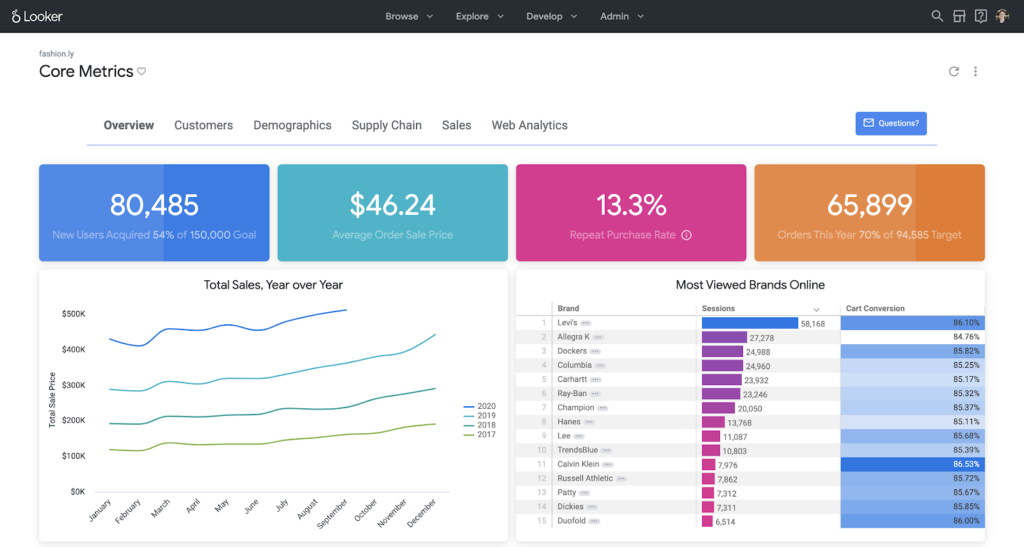
Acquired by Google and integrated into the Google Cloud Platform (GCP) in 2019, Looker is known for its browser-based platform and unique modeling language, LookML. Although not an end-to-end solution, Looker excels at integrating diverse data sources for comprehensive data analysis. Companies such as BuzzFeed, Hearst and The Economist use Looker for its powerful data modeling capabilities.
Advantages:
- Browser-based, easy access via URL.
- Part of the GCP ecosystem.
- Flexible data modeling with LookML.
Disadvantages:
- Not an end-to-end tool; requires data migration.
- Long and expensive initial setup.
Sisense
Founded in Tel-Aviv in 2004, Sisense is renowned for its customization and user-friendly interface. It excels at processing large, complex data sets with AI-driven dashboards. Despite its strengths, Sisense is often perceived as one of the most expensive BI tools on the market. Big players like Motorola, Phillips and Tinder benefit from Sisense’s powerful analytics and customization options.
Advantages:
- Efficient AI-driven dashboard.
- High level of customization.
Disadvantages:
- Higher cost compared to other BI tools.
- Limited integration with other data tools.
Choosing the right BI tool depends on several factors, including the existing technological ecosystem, data processing needs and budget. However, the effectiveness of using these tools goes far beyond the choice of software. It is crucial to have a team of skilled professionals who can implement, manage and extract meaningful insights from these BI tools.
The experience and technical knowledge of professionals in this field are essential to correctly configure the software, optimize its functionalities and ensure that the data is analysed in an accurate and useful way. Without a qualified team, even the most sophisticated tools can fail to deliver the expected value.
Here at Super Plural, we not only offer a wide range of technology and data analytics services, but we also have a team of experts ready to help your company maximize the potential of its BI tools. Our professionals are trained to deal with the complexities of BI technologies, ensuring that you get actionable insights that really drive your company’s growth and innovation.