
A few weeks ago, while writing about E-E-A-T, I left a loose sentence: that Superplural has more than a decade of real accumulated data managing campaigns, and that much of it never became public content—only internal client reports. This is the debt this post pays. We gathered the campaign numbers we’ve managed over the years, combined everything without identifying any individual client, and organized what remained into an honest read of what really works in digital advertising—weighted more heavily toward our operations in Portugal and a real slice of Brazil, where the operation is still taking shape.
Download the full PDF report, with charts and all the data from this study organized: Superplural Analytics: Benchmark of Digital Ads Brazil and Portugal (PDF).
Note on the methodology, no fine print
The numbers below come from some accounts of Google Ads and Meta Ads that Superplural has managed or manages currently, aggregated internally in our platform Superplural Analytics. No metric identifies a client, a specific industry, or an individual account. The dataset is geographically imbalanced on purpose—not by accident: most of the volume comes from our Portugal operation, more mature in terms of years in existence, with a smaller but real share from Brazil, a market where Superplural is starting to return to active work now. I treat that proportion as part of the data, not as a flaw to hide.
The overall picture: 49 million impressions, channel by channel
In total, the base brings together 49,131,852 impressions and 1,647,087 clicks across active accounts, with an overall average CTR of 3.35%. But the overall average hides more than it reveals, because behavior varies in extreme ways across campaign types.
| Campaign type | Impressions | Clicks | CTR |
|---|---|---|---|
| Search | 4,556,560 | 574.857 | 12,62% |
| Performance Max | 30,737,932 | 936.466 | 3,05% |
| Shopping | 4,243,488 | 82.477 | 1,94% |
| Smart | 564.659 | 11.212 | 1,99% |
| Demand Gen | 837.376 | 7.270 | 0,87% |
| Display | 7,610,882 | 34.619 | 0,45% |
| Video | 580.955 | 186 | 0,03% |
The difference between the top and bottom of this table is not subtle—it’s an order of magnitude of more than 400 times between the CTR of Search and that of Video. This isn’t peculiar to our client-account portfolio; it’s the structural logic of each format: Search captures someone who is already looking for something, while Video interrupts someone who was doing something completely different. Stated intent will always beat interruption, in any large enough dataset to show the pattern.
Search’s expensive clicks and Video’s low CPC trap
A high CTR isn’t synonymous with being cheap, and it’s worth undoing that confusion before any reader concludes that “Search is always the best choice because it converts more attention.”
| Campaign type | Average CPC | CTR |
|---|---|---|
| Shopping | € 0.11 | 1,94% |
| Display | € 0.13 | 0,45% |
| Performance Max | € 0.13 | 3,05% |
| Demand Gen | € 0.13 | 0,87% |
| Smart | € 0.17 | 1,99% |
| Search | € 0.20 | 12,62% |
| Video | € 6.91 | 0,03% |
Search has the highest CPC among all the “standard” formats in the table—almost double that of Shopping. That makes sense: you’re competing directly in a declared-intent auction, and everyone knows that click is worth more, so everyone pays more for it. There’s no free lunch in paid media; a high CTR always attracts higher bids in the auction.
The CPC of Video, at € 6.91, may look like an isolated absurdity, but it has a simple technical explanation: YouTube video campaigns are mostly paid for views, not for clicks. The click is a secondary action—rare—inside a format designed for impressions and brand recognition, not for direct conversion. Judging a video campaign by its CPC is using the wrong yardstick to measure the wrong objective. The metric that would matter there is cost per view or qualified reach, not clicks.
Performance Max is the middle ground that most people don’t fully understand
The data that draws the most attention in this table isn’t the top or the bottom—it’s the middle: Performance Max alone concentrates 30.7 million of the 49 million total impressions in the base, more than 60% of the volume, with a CTR of 3.05%. This goes head-on against a common complaint from people who manage media: “Performance Max is a black box.” It is, indeed. But a black box with a volume of that size and a CTR that isn’t trivial isn’t a reason to abandon the format—it’s a reason to stop fighting it and learn how to feed the signals the algorithm uses better (seed audiences, varied creatives, a well-crafted product feed), because in practice that’s where most of the budget of people doing paid acquisition today is already going, whether the manager likes it or not.
What the Brazil data shows about frequency
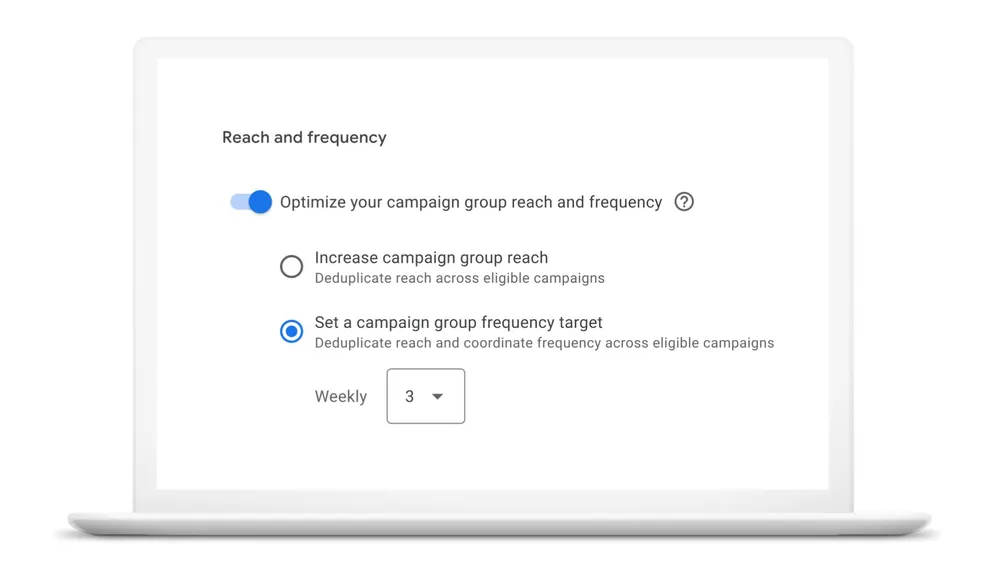
I’ve already written about ideal ad frequency, citing research from Google Meridian and third-party Brazilian market data. Here it’s worth placing our own Brazilian slice alongside that. By analyzing 46 weeks of Meta Ads video and image campaigns managed in Brazil, average frequency was concentrated almost entirely in a range of 1 to 2 exposures per week, with a weighted CTR of 1.93% in that range. We didn’t have enough volume to test higher frequencies, because our own Brazilian campaigns simply never got there.
This doesn’t validate or contradict the number of 2.7 exposures per week as the optimal point. It shows something else—perhaps more interesting: the Brazilian operation we’ve historically managed tends to underexpose, not overexpose frequency. If the market’s fear is “burning out the audience,” at least in our Brazilian sample, the real risk seems to be the opposite—spending less frequency than ideal and leaving performance on the table.
Portugal as a mature lab, Brazil as a growing market
Darcy Ribeiro wrote about Brazil as a people still in formation—an identity that never fully finished coming together, always in process. I like this lens for thinking about our own operation: the Portuguese base is more mature and more voluminous, with accounts running for longer and having a longer optimization track record. The Brazilian base is still literally being formed—growing now. This isn’t a deficiency; it’s a stage. The value of having both bases side by side is precisely being able to use what has already matured in one market to inform decisions in the other, without having to repeat every learning mistake from scratch.
In practice, that means testing hypotheses first where we already have volume and history, and bringing only what has been proven to work for leaner validation in Brazil—rather than burning budget by testing everything from scratch in both places at the same time.
What to do with each channel, in practice
- Search: reserve it for when the goal is to capture demand that already exists. Higher CPC is justified by the quality of the intent—don’t try to compete here just for cheap volume.
- Performance Max: stop treating it like a hostile black box. With 60% of our total volume going through there, the real gain comes from feeding the signals better (seed audiences, varied creatives, a well-crafted product feed), not from trying to micromanage what the algorithm has already decided to automate.
- Shopping: the lowest CPC in the entire table. If you sell physical products with a well-organized catalog, that’s usually where your budget gets more clicks per euro invested.
- Display: don’t judge by CTR—most of the time nobody clicks on banners for the intended purpose. Use it for remarketing and building brand recognition; don’t expect direct conversion performance.
- Video: measure qualified reach and frequency—never isolated CPC or CTR. It’s the wrong metric for the right objective of this format.
What I think about all this
It took me longer than it should have to organize this data and publish it. Not because of lack of numbers—we always had the number; it was a lack of priority to turn a client report into public content. That changes now. From here on, the idea is to update these benchmarks periodically, as the Brazilian base grows and gains enough volume to sustain our own analysis without relying as much on the Portuguese base to provide statistical robustness to the whole.
If you want to compare your own account’s performance against these numbers, or understand where your paid media budget is generating less than what these benchmarks suggest it should, that’s exactly the kind of diagnosis we do in our digital marketing consulting.